Test Coverage tools
SD supplies test (or code) coverage tools for arbitrary procedural languages, including C, C++, Java, C#, PHP, and many more. Such tools provide statistics and detail information about which parts of an application program have been executed (usually by a test suite). This information is invaluable to software teams to help determine the readiness of software for actual use. The type of coverage information collected is branch coverage, which subsumes statement coverage.
Test coverage tools may also be used to locate application functionality. One simply exercises the functionality of interest, and the test coverage tool indicates what part of the application code is executed. This a a very effective way to locate functionality in a large, poorly understood system.
Source Code Instrumentation
SD's test coverage tools operate by inserting language-specific probes for each basic block in the source files of interest before compilation/execution. At execution time, the probes record which blocks get executed ("coverage data"). On completion of execution, the coverage data is typically written to a test coverage vector file. Finally, the test coverage data is used to generate a detailed test coverage report (huge Java example), or can be displayed on top of browsable source text (FORTRAN example below) for the system under test, enabling a test engineer to see what code has (green) or has not (red) been executed.
Why Binary Test Coverage isn't such a good idea
There are tools from other vendors that instrument binaries or class files
rather than source. This seems attractive,
because it seems more convenient for the company to divide development from
test, so the testing people don't need access to code
sources or development tools. However, there is a very
significant downside to binary test coverage tools:
Imprecise answers causes grief for test engineers (see this Stack Overflow complaint about instrumenting Java class files). The basic reason for imprecision from binary/classfile instrumentation tools is that the binary code simply does not have the same shape as the source code, loses information, and often contains additional artifacts introduced by compilation. Not-the-same shape comes from optimizing away code (that is logically executed even if it is optimized away), and splitting/shuffling source code blocks. Most binary files have at best source-code-line resolution; column positions are lost. Yet in source code often multiple conditionals happen within single source lines. Newly introduced code artifacts (e.g., extra jump table entries on case statements) have no corresponding place in the source code, yet contribute (or not) to what has been covered, in ways that are completely opaque to people looking the source code.
Binary instrumentation tools also tend to have considerably more runtime overhead. The reason is simple: to put instrumentation probes into the binary, the binary object code has to be "patched". This typically involves, for each probe point which contains a machine instruction I, replacing I with a JMP instruction to a probe-specific patch that saves the registers, records the probe hit, restores the registers, executes the instruction I, and JMPs back past the probe point. It gets really messy when the instruction I happens to be shorter than a JMP because the instumenter can't change the instruction after I because it doesn't know what other parts of program may transfer control there. This contributes to imprecision ("can't instrument that place") or overhead (more code shuffled around). Worse, the overhead introduced by a probe is magnified if it is in a loop ... and that's where programs spend all their computational resources. (In contrast, a probe inserted into source code in a loop, usually gets lifted out of the loop by the compiler so it is zero cost in the loop; the compiler makes source code instrumentation more efficient!).
As a practical matter, building binary test coverage tools is quite a bit harder than (at what SD does) building source instrumentation tools, because it has to handle lots of strange probe issues, and is specific to target machine instruction sets (x86? Arm? Arm64? PowerPC? JavaVM? CIL? DSPxxx? ...). A consequence is that companies that build such tools tend to build just one for a specific language and instruction set. What this means to the testing organization facing modern, complex software systems having multiple languages and distributed to multiple different computers, is that test coverage tools have to be obtained from multiple vendors. Now the testing organization has to learn about multiple different tools each with its process and idiosyncrasis, and there is no way to combine the test coverage data from multiple vendors into a coherent overall test coverage report.
The differences between binary and source instrumention initally doesnt seem like much, until you are well into testing and tricky question about why some modules aren't getting covered well come up, or the instrumentation damages the application response time producing unrealistic results and execution paths, as well a longer test runs.
Bottom line: source code instrumentation produces better, less confusing answers, and works on real systems with multiple languages.
Test Coverage Process
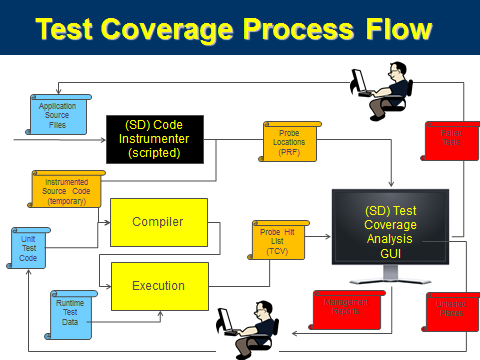
All of SD's test coverage (and profiling) tools operate essentially the same way, as shown in the Test Coverage Process, below. These are key components to each SD Test coverage tool:
- A Project File (not shown in the diagram) which explicitly lists all the source files to be instrumented
- A Source Code Instrumenter, that inserts probes into a temporary copy of the production code. This copy is only used once to feed the compiler for a particular test coverage run, and then it is discarded. The original source code is never touched.
- The instrumenter produces instrumented code, and a cross reference probe reference file that indicates precisely (file, line, column) probes have been inserted.
- A Test Coverage Vector (.tcv) file, produced at end-of-execution and containing a summary of all the probe points that were encountered during test execution
- A Test Coverage Analysis GUI TCV Display that takes the list of probes hit during execution, and using the probe cross reference, displays the source code overlayed with the execution status to allow interactive exploration of the coverage data. The TCV Display can also produce text and XML reports that summarize the tested-ness status at all levels of source code granularity: subsystems, files, classes, and methods depending on the language.
Typical Features
- Not dependent on any particular compiler or object formats
- Works with tens of thousands of files
- Very low probe overhead (one or two machine instructions per executed probe)
- Can accumulate coverage data from multiple execution runs
- Browsable source files overlayed with collected coverage information
- Produces coverage report by application, subsystem and file
- Test Coverage delta computation and display, to enable test case minimization
- Can operate with custom/embedded application execution environments
- Consistent style and operation across different languages
- Probe installer and display tool operate on Windows 2000/XP/Vista/7/8/10
- Application under test can execute in arbitrary native enviroment including embedded WinCE
- Test coverage data from multiple subsystems can be combined into single comprehensive display and summary reports
- Test coverage data from multiple languages can be combined into single comprehensive display and summary reports
- Incremental test coverage (C#, C, C++, Java), telling which tests need to be re-run when source code base changes
Available for the following languages
- C (ANSI, MSVC6, GNU, C99, Oracle's Pro*C)
- C++ (ANSI, MSVC6, MSVS2005-MSVS2012, GNU 3/4/5, and C++14)
- ColdFusion v11
- C# 2/3/4/4.5/5/6
- COBOL (IBM Enterprise)
- Java: client, Server (J2EE), embedded, and RealTime Java, Java 1.2-1.6, Java 7 and 8
- PARLANSE (yes, we use our own tools!)
- PHP4, PHP5 and PHP7
- PL/SQL 10g and 11g
- Python2 and Python3
Semantic Designs also provides profiling tools.
Enhancing test coverage by removing dead or redundant code
A key question for most testing organizations is, "how to get the coverage higher?" The usual answer is "write more tests", which is clearly a lot of work. Another way that takes less effort and has other quality payoff is to remove dead or redundant code. SD provides tools to complement test coverage tools to help with that task.
Thumbs up to Test Coverage tool
"LSI has integrated Semantic Designs' Test Coverage tool into its special firmware build to measure effectiveness of its internal testing. Fantastic support from Sematic Designs and the simplicity of the tool ensured we were able to integrate the tool in our process in just couple of days. Great thing about this tool is, IT JUST WORKS as expected and as advertised. We are already seeing measurable benefits of using the tool. Today, we have quantifiable data to assess our testing methodologies and track the improvements."
-- Abhijeet Aphale, Lead Engineer, LSI Corporation
Unusual Requirements?
Your language not listed, runs in an unusual environment, or you have some custom need? SD can configure a test coverage tool for you! These test coverage tools are based on DMS, and inherit DMS's language agility and scalability. A white paper on how test coverage is implemented with DMS is available: TestCoverage.pdf
