Control and Data Flow Analysis
The DMS Software Reengineering Toolkit provides support for computing various kinds of control and data flows. Serious program analysis and transformation tasks often require a deep understanding of information flows that occur between program components. These information flows are induced by the various runtime entity declarations (variables and procedures) and the references, explicit or implied, between them, which are in turn implied by the semantics of the language being processed. Since these semantics are not always directly visible in the syntax of the language, trivial syntax analysis cannot easily discover them, and typically an analysis procedure that understands the semantic implications of the syntax needs to be constructed to make the information flows accessible.
The process of making such information flows visible is called "flow analysis". The result of such an analysis is usually a graph, often with annotations. Commonly, a control flow graph ("flowchart") is produced, and data flow analyses augment that graph with additional arcs or annotations on the nodes of the control flow graph ("facts").
Control Flow Analysis and Graphs
A control flow graph shows how events in the program are sequenced. Traditional flowcharts are limited to executable statements ("boxes"), conditional tests ("diamonds") and subroutine calls ("hexagons"). DMS flow graphs represent these concepts directly as nodes, and attach the AST for the originating tree to each control flow node. Flow graphs for modern languages require more sophistication to represent more complex control flows. DMS flow graphs can include regions (e.g., for exceptions), indirect GOTOs, fork-join and partial-order nodes to represent parallelism (including concurrency or simply lack of defined order). As examples, DMS-derived C control flow graphs contain fork-join nodes used to model the C standard's notion of "sequence points", where subexpression with unspecified order must be complete before further computation occurs (e.g., the arguments to a function are evaluated in an arbitrary order, but the function call cannot occur until all are evaluated). Control flow graphs for GCC C source code can also contain indirect GOTO nodes, to model GCC's "goto *exp;" construct.
Control flow graphs for a specific language (e.g, C or a dialect) is often implemented in DMS by using an attribute grammar evaluator that propagates control points around the abstract syntax tree and assembles those control points into a completed graph. These evaluators use a DMS Control Flow graph domain and a supporting library of control flow graph facilities that it provides. Using these evaluators and this library, it is generally straighforward to construct flow graphs for many modern languages.
Often it is important to know when one computation always occurs before another ("dominates"). The library can compute dominators and post-dominators from standard DMS control flow graphs. It is also useful to know under what condition some control flow node executes; the library also computes this and decorates the control flow graph with such "control dependence" arcs.
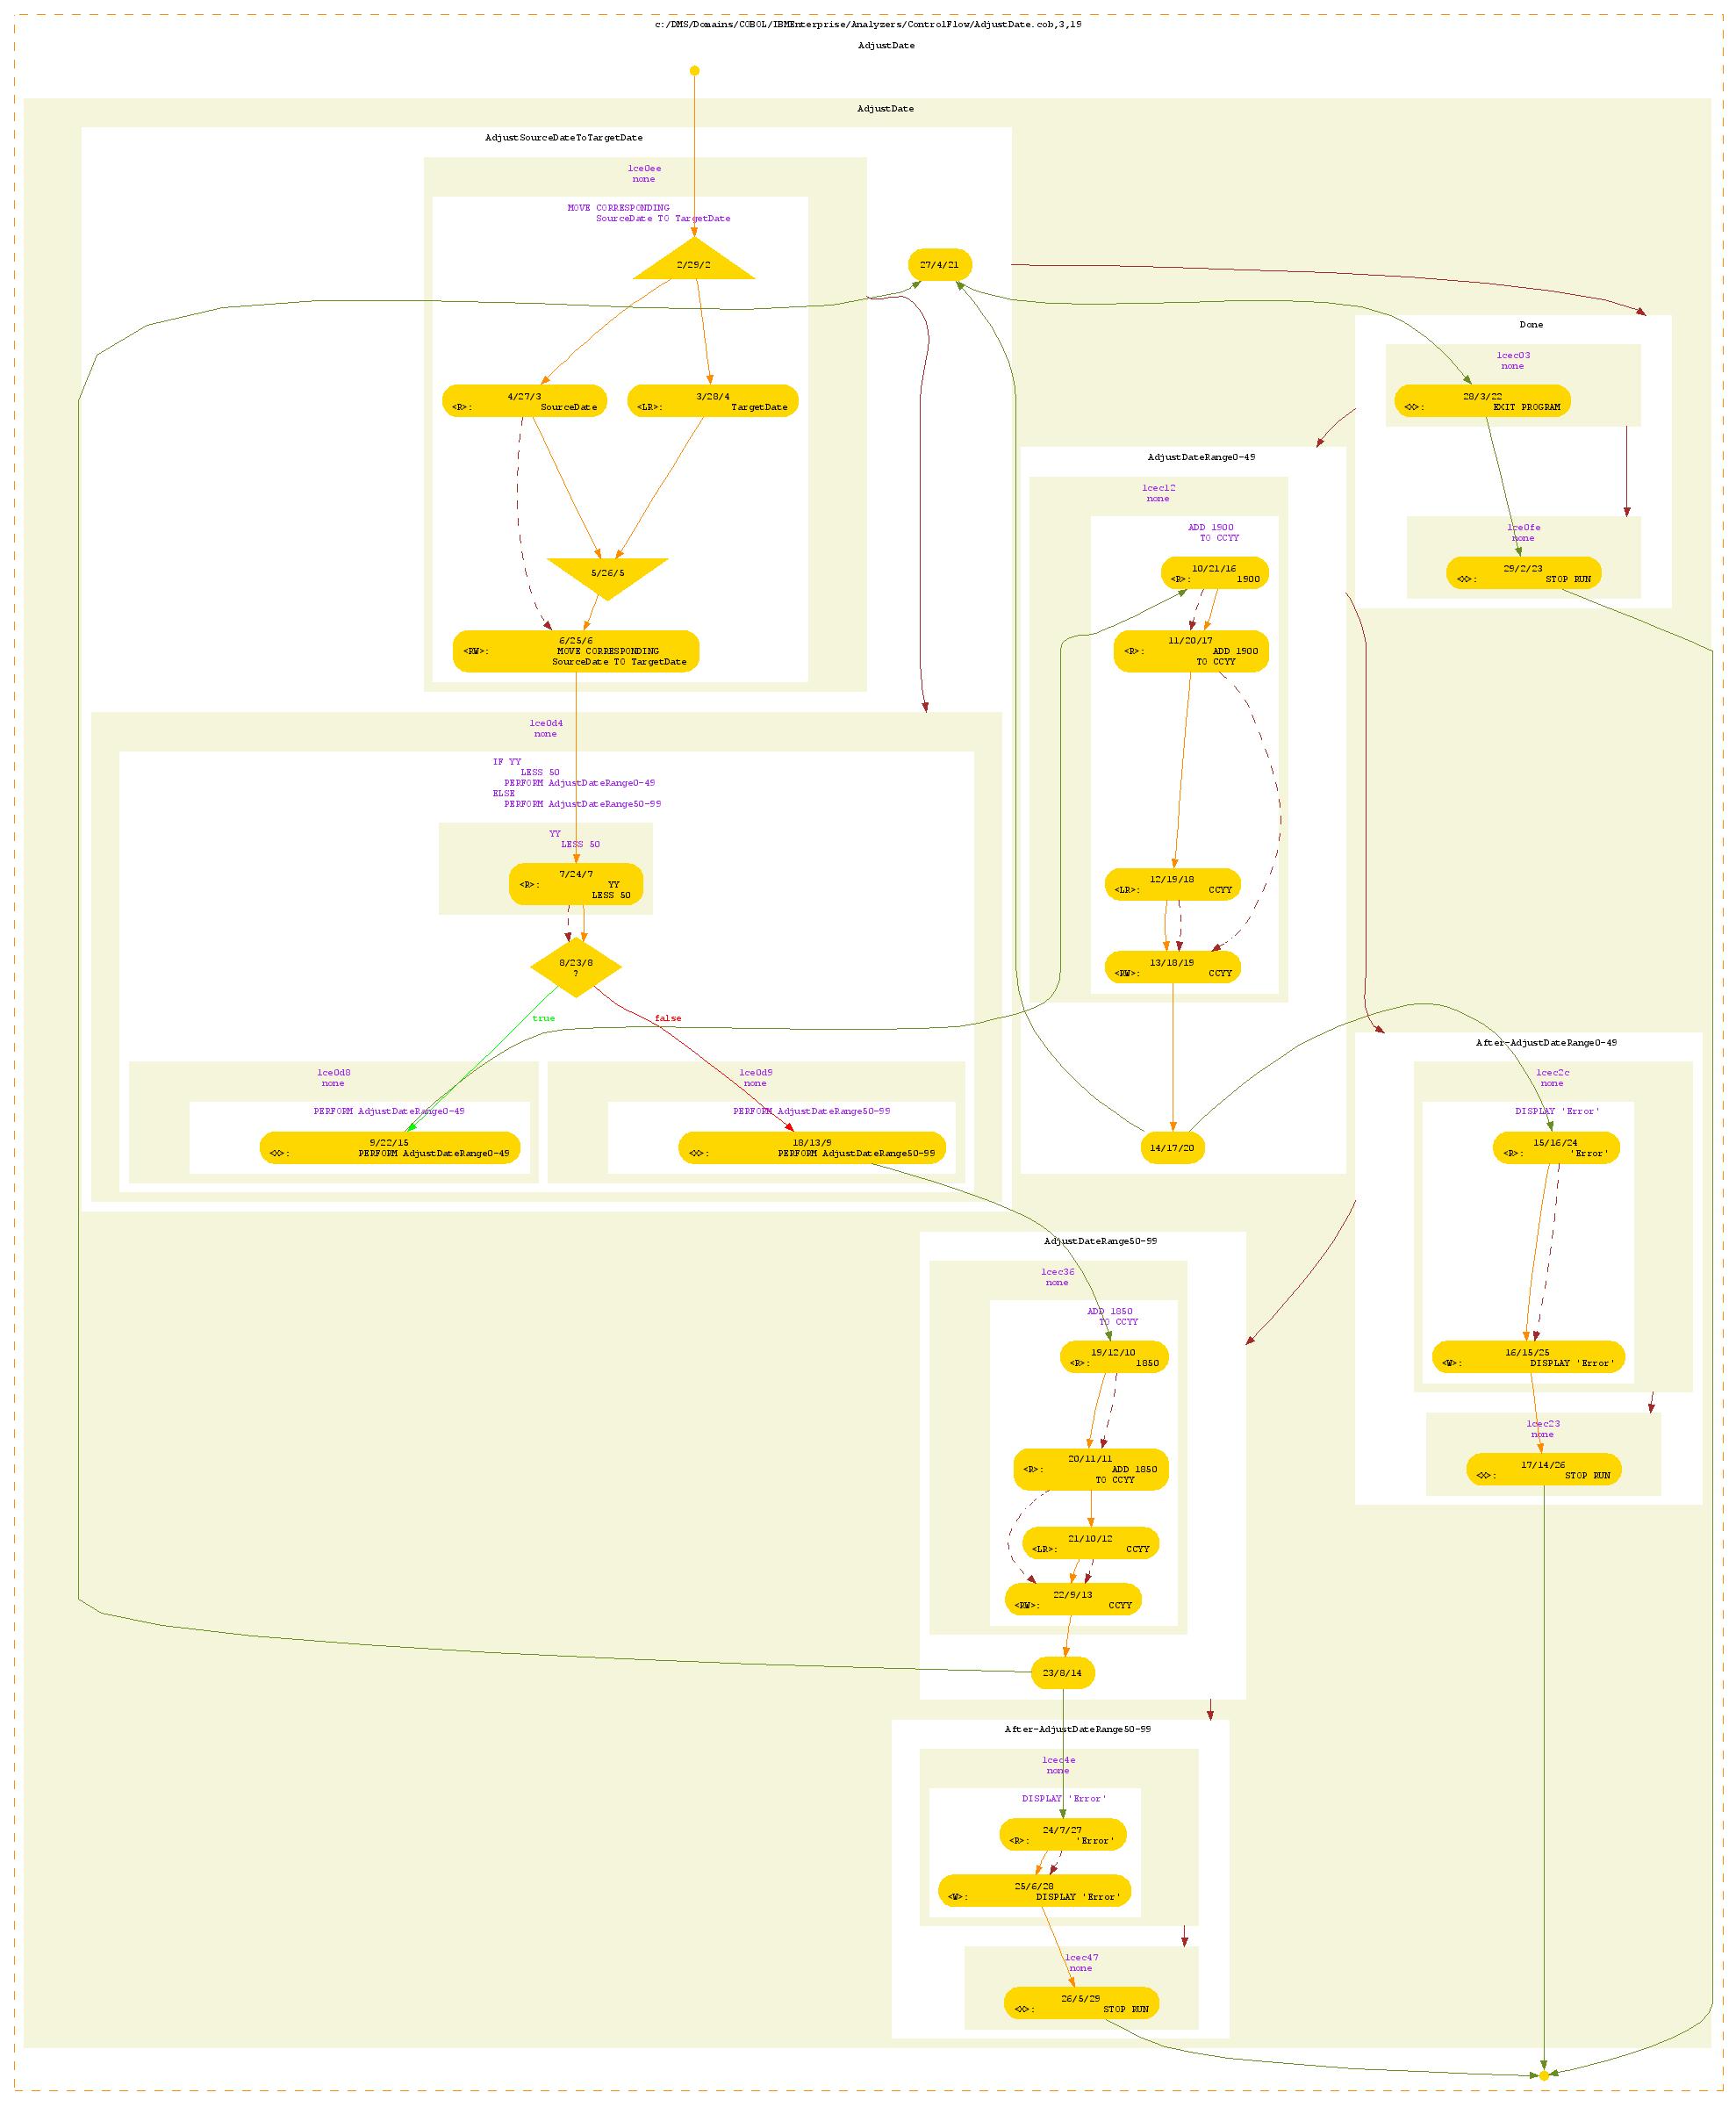
Example COBOL Control Flow Graph
Here is a sample control flow graph.
You may need to expand your browser view and scroll to appreciate it.
It was produced by DMS's COBOL Front End, for the IBM Enterprise dialect.
Key to Control Flow graph interpretation:
- Gold Nodes: Control Flow nodes, usually containing computations
- Small Circle: Entry and Exit nodes, single entry or exit only
- Round-edge boxes: Computations, multiple entry but single exit
- Diamond nodes: Decisions, single entry with True and False control flow exits
- Pointing-up triangles: Fork nodes, single entry through top, multiple exit at bottom
- Pointing-down triangles: Join nodes, multiple entry through top, single exit at bottom
- Orange edges: Unconditional control flow
- Red edges: "False" condition control flow
- Green edges: "True" condition control flow
- Dashed Red edges: "False" control dependences
- Dashed Green edges: "True" control dependences
- Background rectangles: inferred region graph
Data Flow Analysis and Graphs
Data flow analysis determines how data flows through the program. The variety of data flows depends on the nature of the desired task, but common forms include "reaching definitions" (e.g., which variable assignments may reach which uses), etc. Such analyses are often computed by extracting facts directly from the syntax/symbol tables (e.g., "variable X in scope Y is modified at control flow node N") and composing facts based on syntax constructs found at other points in the code (e.g., "X is modified at M, and M postdominates N"). DMS provides iterative (forward and backward) flow analyzers based on generic sets of facts to enable many flow analyses to be straightforwardly encoded.
Given basic sets of facts about definition points, the data flow library computes reaching, definition-use, and use-definition chains over standard DMS control flow graphs.
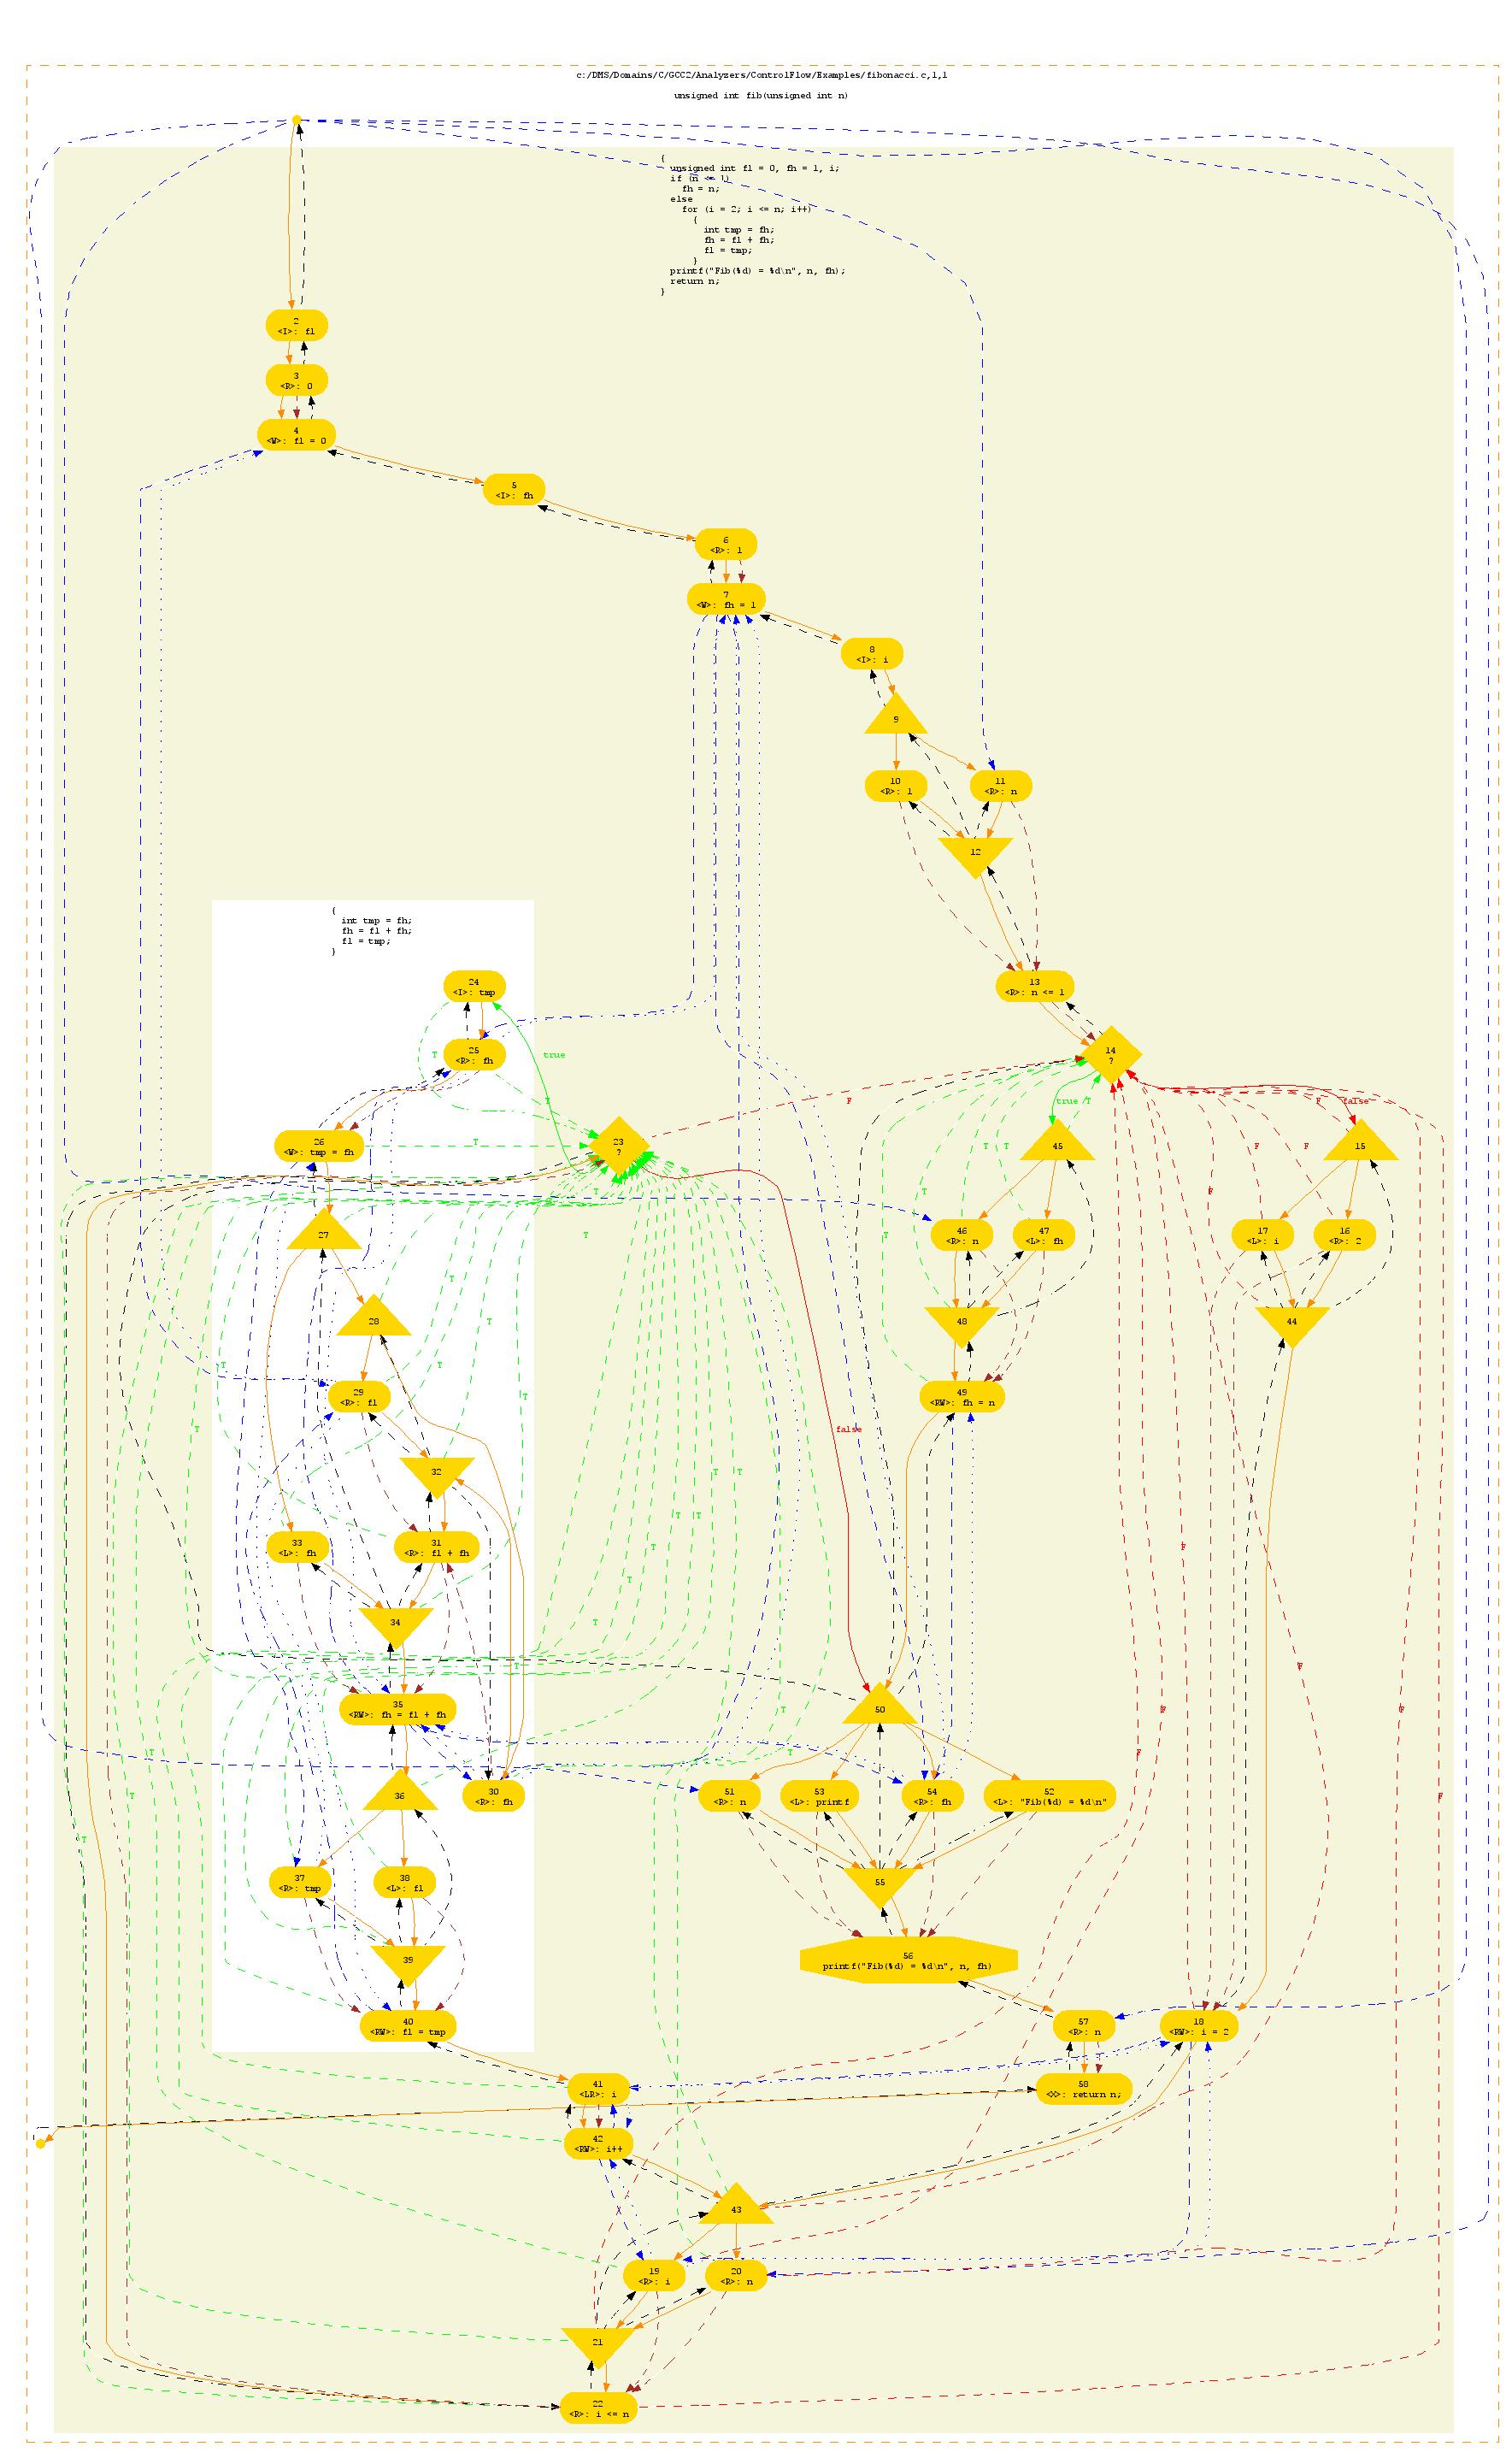
Example C Data Flow Graph
Here is a sample flow graph containing
both control and data flow. You may need to expand your browser view and scroll to appreciate it.
It was produced by DMS's C Front End, for the GCC2 dialect.
Key to flow graph interpretation:
- Control Flow: see key for Control flow above
- Data Flow
- Dashed Brown edges: Data flows from value producers (e.g. subexpressions) to value consumers (e.g., operators)
- Dashed Blue edges: Definition-use chains (via reaching definitions)
- Dotted Blue edges: edges for use-definition chains (via reachable uses)
Local/Global Points-to Analysis
Many programming language offer pointers or references to data entities (Java's notion of "object" is really a pointer to structure containing class member data elements). To understand how a program works, it is extremely useful to know, for each pointer variable in a program, the set of possible data items to which it may point.
DMS provides generic local and global points to analyzers. Local points-to analysis uses just facts from a single compilation unit to conservatively estimate points-to targets. Global analysis collects points-to facts and value-copy facts across an entire system of compilation units, and computes points-to facts for the entire system. It has been applied to systems of C code of up to 25 million lines of code. At present these analyzers are control-flow, context, and field independent, but more sophisticated versions are planned.
Global points to analysis results can also affect def-use chains, because as either one may be via a pointer.
Call Graphs
A call graph is very useful as a data structure to support the automation of propagating information across program elements, and useful when rendered visually to help programmers understand the code.
It is relatively easy to construct a call graph for an application programming language once a parser exists, by detecting the direct-call language idioms and simply collecting them. Thus module A containing a CALL B idiom easily provides an A-calls-B fact. Most programming languages (C, C++, Java [called virtual methods], ...) contain indirect call facilities, whereby module A can call some function for which A has a pointer. Extracting call graphs in the face of pointers requires points-to analysis to provide accurate results. DMS combines direct call fact extract with points-to analysis to build complete system call graphs. DMS has been used to generate call graphs for systems with tens of millions of lines of code, having hundreds of thousands of functions.
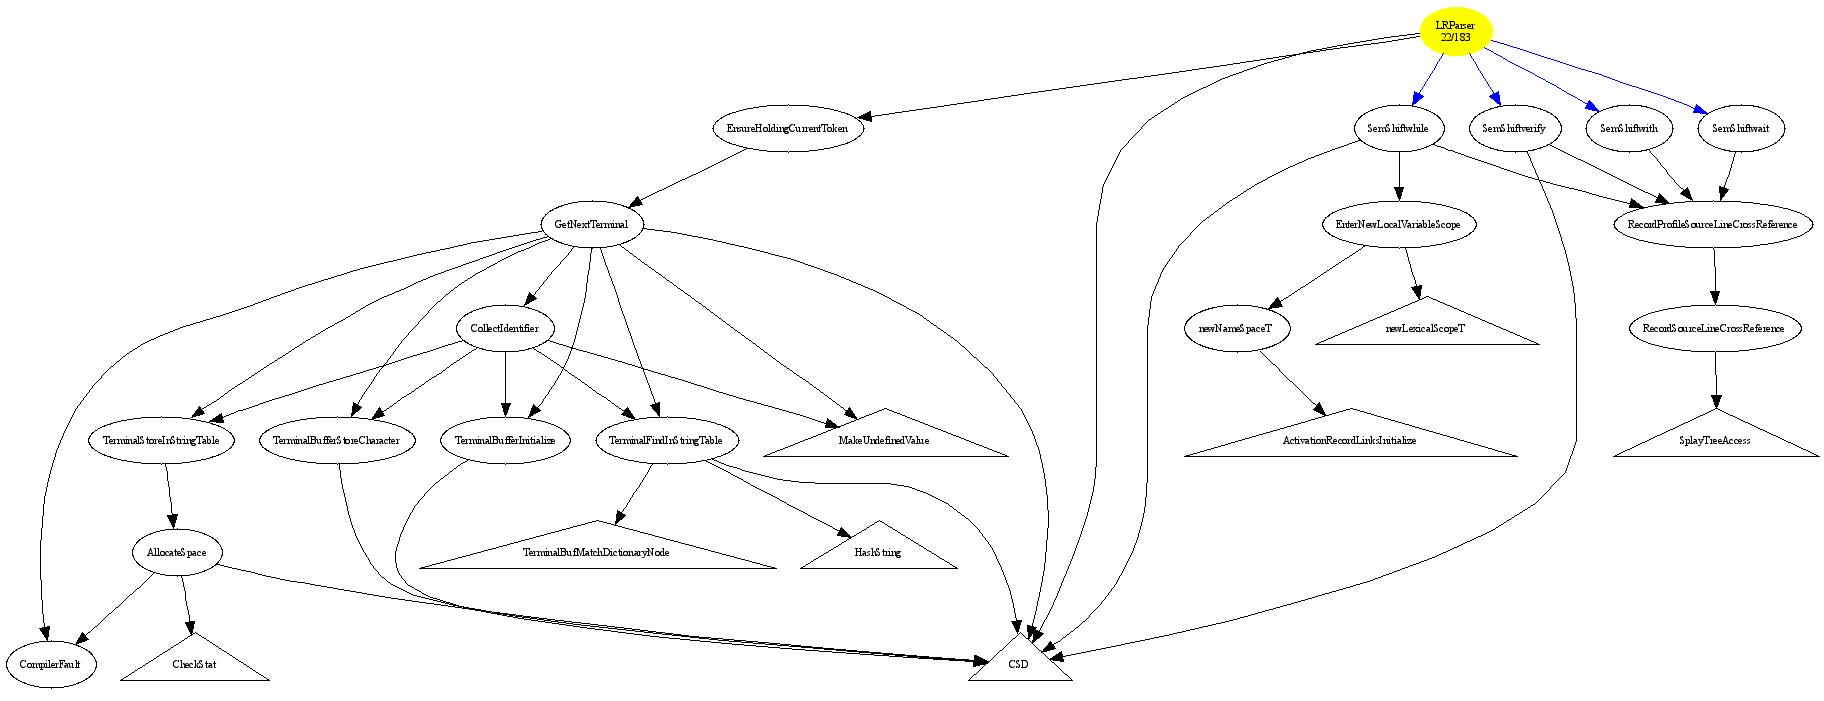
Here is a Sample Call graph extracted by DMS from a large C program. The call graph data structure is first constructed, and then a rendering step using DOT is use to display arbitrary sub graphs of the full graph to ensure that the rendered graph is of reasonable size for people to grasp. The rendered subgraph is parameterized by a root function name, call width, call depth, and a set of "stop" function names. Call depth controls how deep a chain of calls may go in the rendered graph. Call width controls how many callees are rendered for a particular function node when there are too many indirect call targets. The stop functions terminate the call graph if encountered, and are usually chosen because those functions do not contain details of interest. Round nodes represent function names that call other functions. Black arcs represent direct calls, and all such direct arcs are represented in the graph. Blue arcs represent indirect calls computed using the points-to analysis; if a pointer has more than "width" possible targets, only a "width" subset are shown as representative. Triangle nodes represent functions at the bottom of the call tree; those colored in red are at a depth limit of the call graph and have futher unshown children.
