COBOL Test Coverage Tool
The COBOL Test Coverage tool enables the collection and display of code coverage data on COBOL software source code bases of arbitrary size. It is a member of SD's family of Test Coverage tools.
COBOL Test Coverage Features
- Dialects: ANSI COBOL85, IBM VS COBOL II, IBM Enterprise
- Not dependent on any particular compiler
- Works with arbitrary subsets of source code base
- Can accumulate data from multiple test runs into one or more test coverage vector (TCV) files
- Can handles
tens of thousands of source files - Extremely low probe overhead
- Operations to combine test coverage data (TCV files) for unions, deltas, intersections
- Produces coverage report by system, program, section, and paragraph.
- Test coverage collection can run on platform separate from Test Coverage Tool
The COBOL Test Coverage Tool has an intuitively simply graphical display. It shows
- Eligible test coverage vector (TCV) result files
- Selected/accumulated/computed TCV files
- List of files being tested for coverage
- Locations of probe points in files
- Browsable source text of file of current interest
- Covered/uncovered status of each probe point on file source text
- Summary statistics for percentage covered
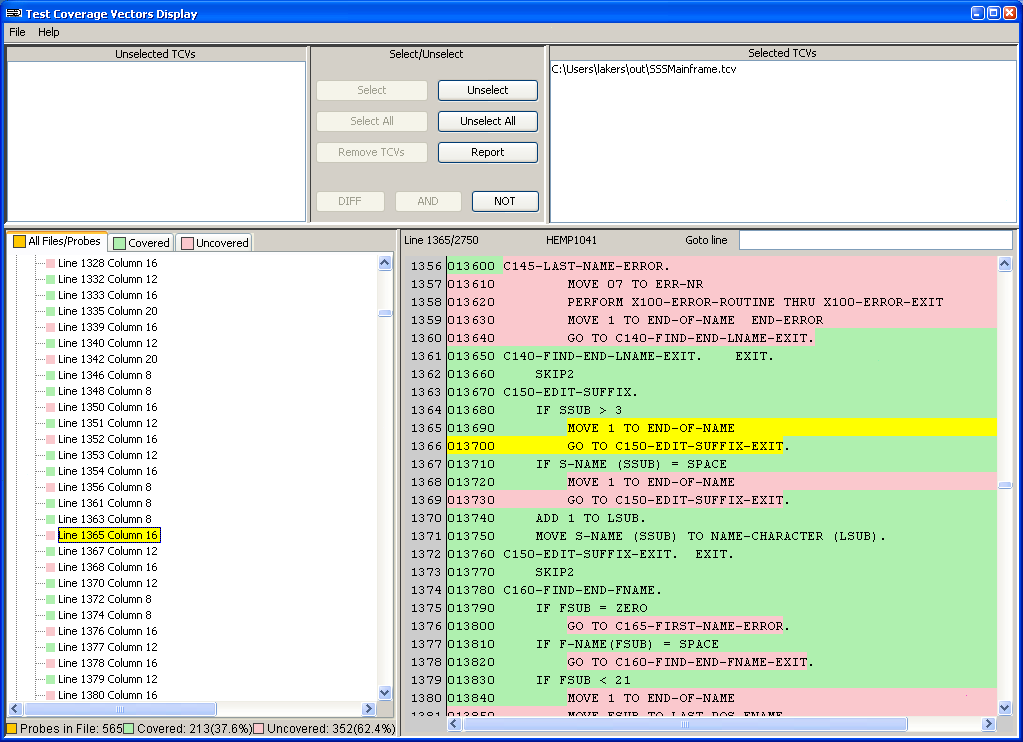
Here is a screenshot (in a popup window) of the COBOL Test Coverage Display. If you have popups disabled, try this link: screen shot. The example shows test coverage data from a single TCV file. Green intervals in the program text pane illustrate portions of code that were covered by the tests recorded in the TCV file; red intervals indicate those that were not covered. The yellow interval is the selected probe, which you can see from the color key beside the probe in the browser indicates an uncovered portion. Multiple TCV files, each representing distinct collections of usage data, may be overlaid in the display to indicate aggregated test coverage.
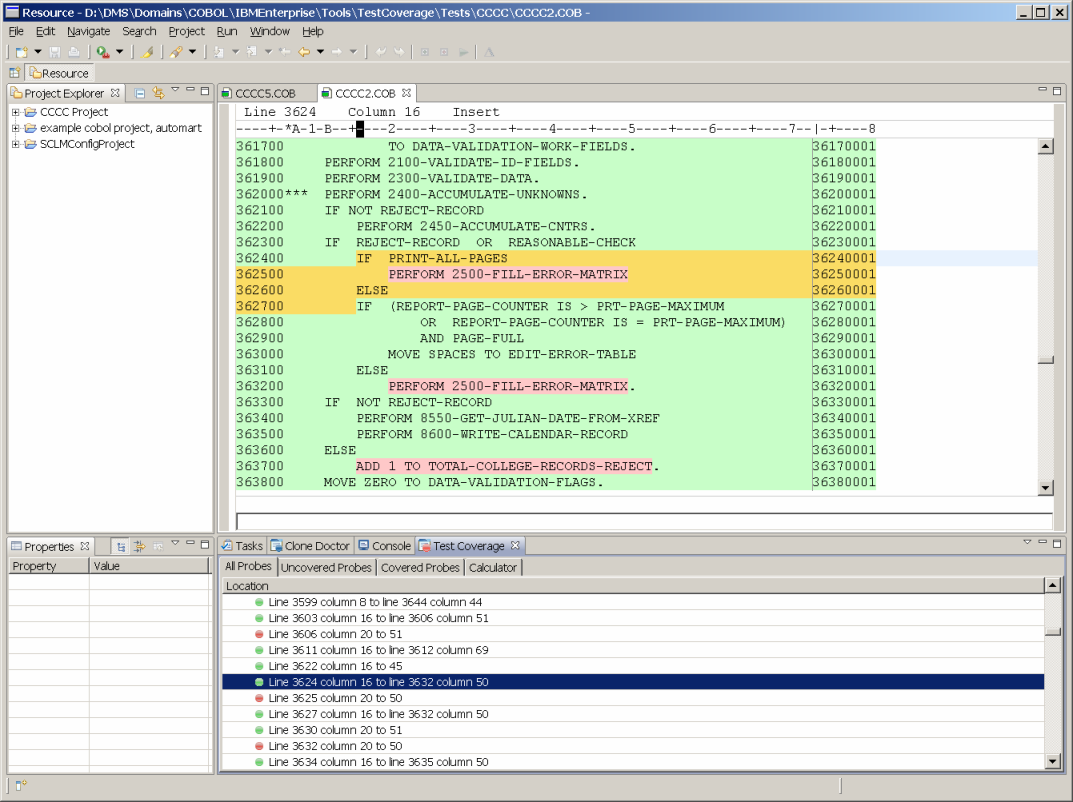
Here is a screen shot illustrating a different graphical user interface which Semantic Designs developed for the Rational Development for System Z™ (RDz) Environment. The screen is organized differently, but conveys the same information. The pane in which the target code appears is an editor which in this case specifically supports COBOL. Test coverage results are produced in an format that is amenable for communicating with other GUIs as well.
Other COBOL dialects can be accommodated.
Semantic Designs also offers COBOL Profiler Tools and other COBOL tools.

)